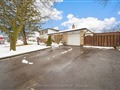
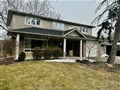
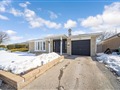
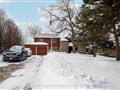
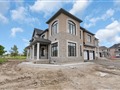
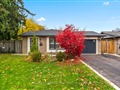
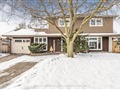
11 Orchard Dr
$911,988
Comparative Market Analysis
Jun 2, 2025
NOT AN ACTIVE LISTING
Historical Performance
| Period | $ Change | % Change |
| 1 Day | +$237 | +0.026% |
| 7 Days | +$24 | +0.003% |
| 30 Days | -$2,108 | -0.231% |
| 3 Months | -$3,950 | -0.431% |
| 6 Months | +$12.6k | +1.41% |
| 1 Year | -$48.2k | -5.02% |
| 3 Years | +$124k | +15.7% |
| 5 Years | +$237k | +35.1% |
| 10 Years | +$479k | +111% |
List My Property
Real Estate Statistics
Financing Solutions
Browsing History
41 Colchester Ave, Brampton
2 seconds ago
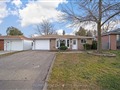
91 Zia Dodda Cres, Brampton
3 seconds ago
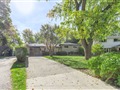
11 Sleightholme Cres, Brampton
4 seconds ago
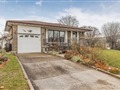
13 Mario St, Brampton
5 seconds ago
28 Compassion Cres, Brampton
6 seconds ago
AS SEEN ON


Are You a Licensed Real Estate Agent or Broker?