ADDRESS
Call: 416-800-1055
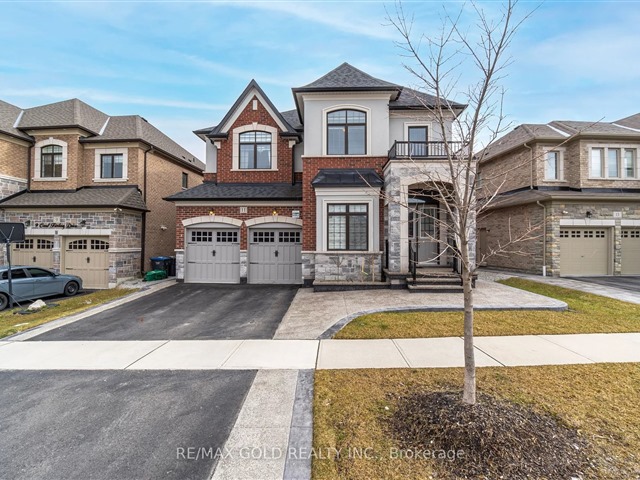
PROPERTY TYPE
2-Storey, Detached House
11 + 2 Rooms Total, 1 + 1 Kitchens
4 Parking Spaces
PROPERTY FEATURES
Library, Park, Public Transit, School
Finished, Sep Entrance Basement
Brick, Stucco/Plaster Exterior
Book Showing
Request More Info
Send Text Message
SALES HISTORY
03/02/2025
FOR SALE
$1,849,900
XX/XX/20XX
SOLD
$X,XXX,000
XX/XX/20XX
SOLD
$X,XXX,000
PROPERTY TAXES
Call 416-800-1055
PROPERTY DESCRIPTION
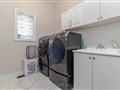
Come & Check Out This Luxurious & Spacious Detached Home With Finished Basement + Sep Entrance. Built On 51 Ft Wide Lot!! 5 Bedroom, 5 Washrooms (3 Full Washrooms On The Second Floor). Main Floor Offers Sep Family Room, Combined Living & Dining Room. Fully Upgraded Custom Kitchen With Quartz Counters, Stainless Steel Appliances, Central Island & Backsplash. Main Floor Comes With Den. Second Floor Offers 5 Spacious Bedrooms + 3 Full Washrooms. Master Bedroom With 5 Pc Ensuite Bath & Walk-In Closet. Fully Finished Basement With 2 Bedrooms, Kitchen & Full Washroom. Sep Laundry In The Basement. Brick/Stone/Stucco Exterior. **Extras** All Existing Appliances: Stainless Steel Fridge, Stove, Dishwasher, Washer & Dryer, All Existing Window Coverings, Chandeliers & All Existing Light Fixtures Now Attached To The Property.
LEGAL DESCRIPTION
Block 153, Plan 43M2014
Call: 416-800-1055
BATHROOMS
2-piece on main level
5-piece on 2nd level
4-piece on 2nd level
3-piece on bsmt level
LIVING ROOM
Main Level
Hardwood Floor, Combined W/Dining, Pot Lights
DINING ROOM
Main Level
Hardwood Floor, Combined W/Living, Pot Lights
FAMILY ROOM
Main Level
Hardwood Floor, Fireplace, Pot Lights
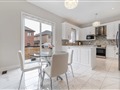
KITCHEN
Main Level
Ceramic Floor, Quartz Counter, Stainless Steel Appl
BREAKFAST
Main Level
Ceramic Floor, Combined W/Kitchen, W/O To Yard
DEN
Main Level
Hardwood Floor, French Doors, Window
PRIM BDRM
2nd Level
Broadloom, W/I Closet, 5 Pc Ensuite
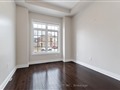
2ND BEDROOM
2nd Level
Broadloom, Closet, Window
3RD BEDROOM
2nd Level
Broadloom, Closet, Window
4TH BEDROOM
2nd Level
Broadloom, Closet, Window
5TH BEDROOM
2nd Level
Broadloom, Closet, Window
BEDROOM
Bsmt Level
Broadloom, Closet, Window
Book Showing
Request More Info
Send Text Message