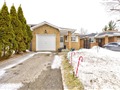
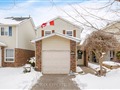
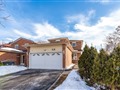
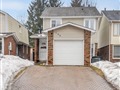
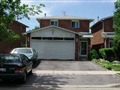
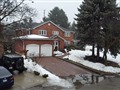
100 Tanager Sq
$981,315
Comparative Market Analysis
Jun 2, 2025
NOT AN ACTIVE LISTING
Historical Performance
| Period | $ Change | % Change |
| 1 Day | +$248 | +0.025% |
| 7 Days | +$66 | +0.007% |
| 30 Days | -$2,004 | -0.204% |
| 3 Months | -$3,275 | -0.333% |
| 6 Months | +$15.7k | +1.63% |
| 1 Year | -$47.1k | -4.58% |
| 3 Years | +$174k | +21.6% |
| 5 Years | +$302k | +44.4% |
| 10 Years | +$585k | +147% |
List My Property
Real Estate Statistics
Financing Solutions
Browsing History
25 Rosepac Ave, Brampton
1 second ago
75 Somerset Dr, Brampton
2 seconds ago
77 Rosepac Ave, Brampton
3 seconds ago
46 Monterey Ave, Brampton
4 seconds ago
35 Muskoka St, Brampton
5 seconds ago
80 Whitehaven Dr, Brampton
6 seconds ago
46 Whitehaven Dr, Brampton
7 seconds ago
93 Somerset Dr, Brampton
9 seconds ago
25 Cashel St, Brampton
9 seconds ago
43 Tanager Sq, Brampton
10 seconds ago
AS SEEN ON


Are You a Licensed Real Estate Agent or Broker?