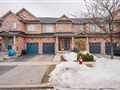
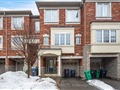
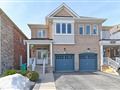
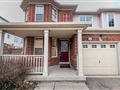
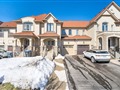
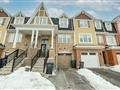
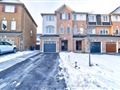
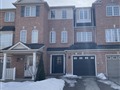
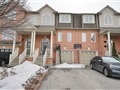
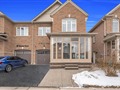
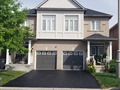
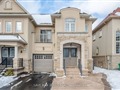
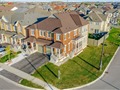
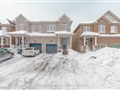
100 Fandango Dr
$1,120,560
Comparative Market Analysis
Jun 28, 2025
NOT AN ACTIVE LISTING
Historical Performance
| Period | $ Change | % Change |
| 1 Day | +$613 | +0.055% |
| 7 Days | +$1,793 | +0.160% |
| 30 Days | -$459 | -0.041% |
| 3 Months | -$1,642 | -0.146% |
| 6 Months | +$23.1k | +2.10% |
| 1 Year | -$34.4k | -2.98% |
| 3 Years | +$273k | +32.2% |
| 5 Years | +$424k | +60.8% |
| 10 Years | +$645k | +136% |
List My Property
Real Estate Statistics
Financing Solutions
AS SEEN ON


Are You a Licensed Real Estate Agent or Broker?